
Regulatory Trading Desk (RTD) Optimization Under FRTB
In January 2016, the Basel Committee for Banking Supervision (BCBS) released revised minimum capital requirements for market risk following their eight-year long Fundamental Review of the Trading Book (FRTB). This framework represents an overarching view of how risks from banks’ trading activities and portfolios should be assessed and quantified through a credible and intuitive relationship with capital requirements. Principal components of the new guidelines include: a clear and impermeable boundary between banking and trading books; replacement of VaR by expected shortfall as a risk measure; revised sensitivity-based standardized approach; and revised expected shortfall-based internal model approach with differentiated liquidity horizons.
These requirements—which are set to be implemented within every major jurisdiction around the world—will profoundly impact how trading desk structures will be organized, managed and monitored. Capital frameworks will now be implemented and regulated at the desk level rather the enterprise level. Risk factors within trading instruments will be disaggregated with a multitude of sensitivities. Each sensitivity will need to be separately modeled. Risk factors for which historic market data cannot be obtained over a ten-year stress horizon will be deemed to be non-modellable and subject to punitive capital treatment.
As a consequence of the coming regulatory reforms, existing desk structures, now called Regulatory Trading Desks or RTDs under FRTB, will need to be completely reorganized. Less liquid instruments may need to be separated from “flow” instruments. Netting, which will be more constrained, will have to be remodeled, as will default risk, credit spread risk and the trading book-banking book boundary. New required tests, like P&L attribution and revised backtesting, will also need to be considered. Operating costs as well as capital costs may increase incrementally for each new trading desk. All of this will create the need for banks to fundamentally change their RTD framework to ensure costs, capital and risk management are properly aligned and ideally optimized.
In this paper, we provide a glimpse on a new methodology for quantifying the value of each RTD to a bank including methodologies for dealing with some of the less-tangible drivers. By consolidating complex metrics into a simple red-yellow-green depiction of each RTD, we create building blocks for more the more complex construction of global business platforms while still considering all the real-world drivers. Our methodology envisions that robust construction of RTD structures, supported by quantitative impact studies, can take place in a modular way such that supporting groups such as risk, reporting, treasury, and vendor management will have a clear model for adding, removing and modifying RTDs as changes are inevitably made over time.
Trading desks exist, thrive and liquidate for reasons beyond simple returns, but, on the whole, trading must generate meaningful revenues and returns to a firm or risk becoming displaced. This is even more true under the FRTB which requires banks to undergo a granular rethink of how their trading desks are assembled, capitalized and governed. Our experience as practitioners informs us that at least 80% of the cost for any bank system change resides in implementation rather than actual vendor cost. For banks dealing with increasingly dynamic regulatory environments, markets and technology, low-cost flexibility in RTD construction, deconstruction and reconstruction will be ever more critical.
Valuing the RTD
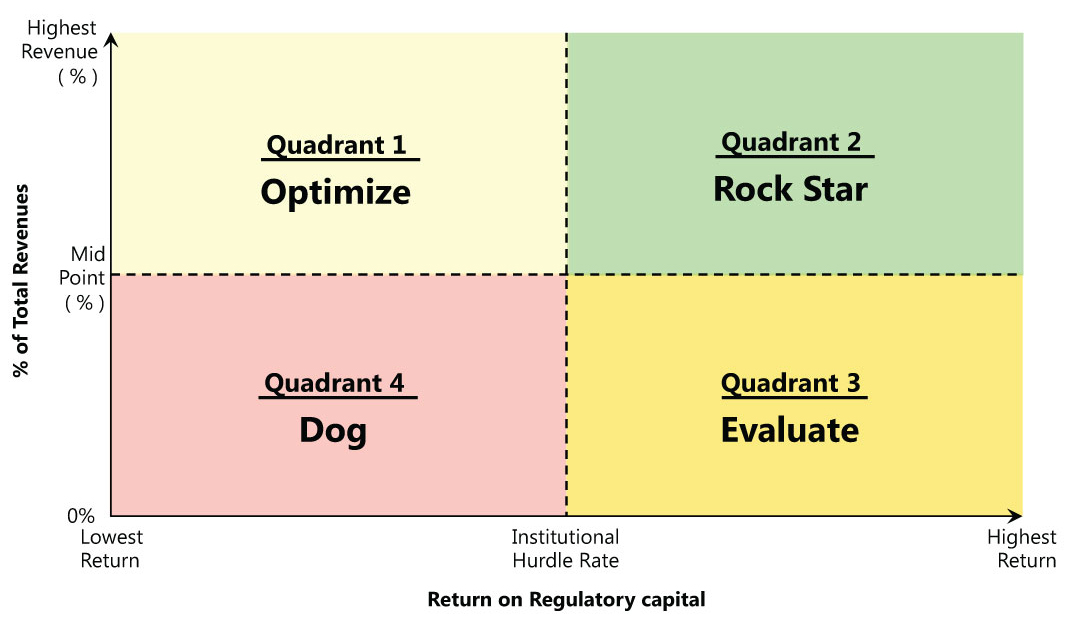
Figure 1 below illustrates how we first consider the valuation of a RTD by quantifying importance (size) against return on regulatory capital (RORC). Size is determined by the relative revenues of the RTD as a percentage of all trading revenue. The scale can be adjusted based on a bank’s size and number of trading desks. RORC is determined by dividing the fully costed Net Income After Tax (NIAT) against the expected regulatory capital using either the standardized or internal model approach. This approach enables us to bucket each RTD into one of four quadrants for further examination. We label these quadrants “Rock Star,” “Dog,” “Optimize” and “Evaluate” as shown below.
Figure 1: RTD Value Matrix
After segmenting each RTD by quadrant, we then tag each desk with “High, Medium, or Low” marks from the modifier box in Table 1 below.
| Table 1 – RTD Valuation Modifiers |
|---|
|
Under our schema, modifiers act as a separate test to easily ask specific additional questions about the entire portfolio of RTDs. For example, to assess “What is my overall IMA cliff potential?”, simply take the total RTDs labeled as “high IMA cliff risk” and add the difference between the SA and IMA capital (both calculated daily). To assess “Where are my laggards in growth?”, list all the RTDs in tagged “low growth.” We tag each of these modifiers dynamically using objective metrics monthly for subsequent reporting and evaluation.
To see how this works in practice, let’s examine a use case.
Case Study: HomeBase
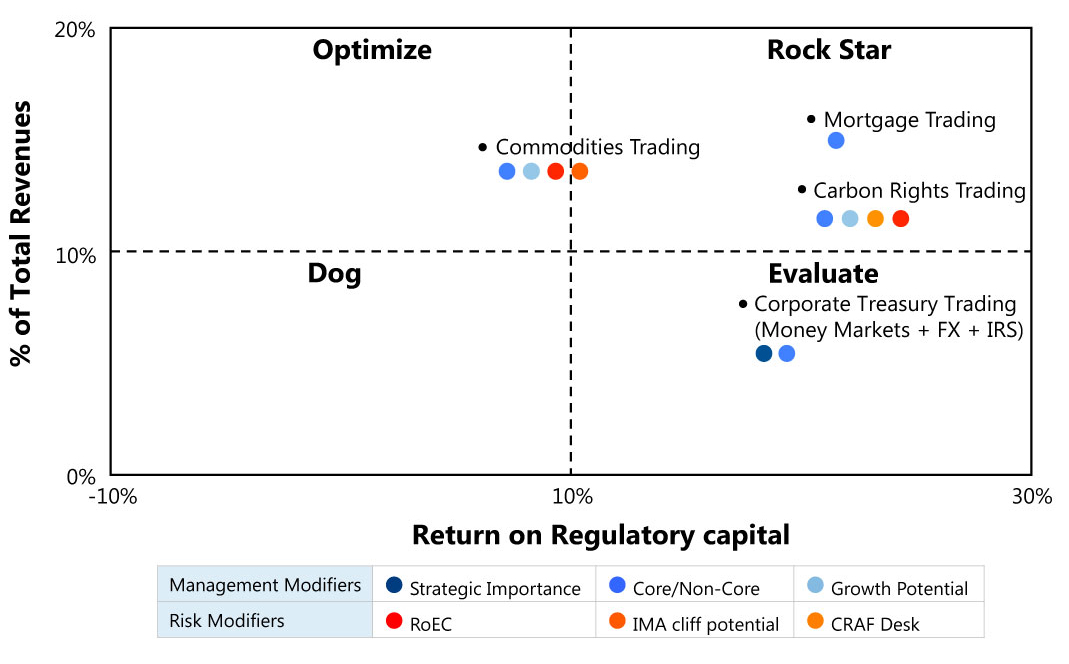
HomeBase is a regional Texas-based bank focusing on retail deposits, mortgage lending and small commercial lending. It also has a niche specialty business serving the energy and utilities sectors using proprietary models for trading commodities and carbon rights developed using proprietary trading data developed over many years. Outside of these specialty trading platforms, HomeBase maintains very modest trading desks in FX and rates, but volumes in these desks are very low and spreads are compressed. Corporate Treasury also maintains a small money markets desk which it uses to supplement daily liquidity needs and maintain its name in the market. HomeBase has a targeted 10% return on regulatory capital. Figure 2 illustrates the HomeBase picture prior to optimization.
Figure 2: Before FRTB Optimization

Under FRTB, HomeBase faces several capital challenges which it will need to address. First, its market leading commodities business delivers suboptimal returns under the IMA and this business has a high likelihood of failing its IMA tests over time, yet this is a large business for HomeBase and many of its clients are also core to its M&A and carbon trading businesses. Second, the carbon trading business, though profitable, cannot obtain IMA approval because of a lack of pricing history for a small segment of its market. Thus, the carbon trading business operates under the higher SA framework. Its other trading desks are small, but at least two, FX and money markets, must be maintained for client and strategic reasons, respectively.
After using our methodology, HomeBase makes significant improvement on returns without sacrificing either client service or meaningful revenues. In the commodities and carbon trading businesses, HomeBase elects to exit the very thinly traded portions of those businesses for which it does not have robust, proprietary data. The impact on revenues is modest but the impact to returns is significant. Second, HomeBase consolidates its Money Markets, FX and IRS desks into a single desk operated by corporate treasury. This consolidation not only creates operational efficiencies with reporting, oversight and name in the market, but also reduces required regulatory capital by accessing modest netting across the books. After examination, HomeBase determines that its mortgage trading desk is doing well as is and elects to increase its investment here coordinated with a parallel retail lending push. The results of HomeBase’s optimization program are illustrated in Figure 3.
Figure 3: After FRTB Optimization
Putting it All Together
In general, we can paint a complete, one-page picture for the value of each RTD to the entire organization or to whatever subset of the organization needs to be examined (see figure 4). The quadrant/modifier framework can be used for ring-fenced entities, for example an Intermediate Holding Company (IHC) in the U.S., or can be used to compare RTD’s across jurisdictions with similar asset classes or supporting similar businesses.
A simplified version of the quadrant analysis can also be performed across single modifiers to, for example, consider where to invest amongst all the high growth opportunities in a region or, conversely, which desks align ROEC with RORC. The quadrant analysis can also be used within a single product or business line to better assess which core businesses to invest in and which to pare back. Best of all, this model is run off of quantitative data in the first instance, giving greater transparency to what can be challenging conversations across business lines competing for the same capital dollars.
At GreenPoint Financial, we are also deploying machine learning technology to enhance transparency and effectiveness of this decisionmaking process. We expect RTD Optimization will be a major competitive driver for depository trading platforms over coming years.
- Note that returns are assumed to be based on a fully costed (NIAT) basis using IMA or SA as appropriate. Hard dollar subsidies may be allowed.